Generating Reports
The Reports tab in Scantranx allows you to view, filter, and export detailed sales and inventory reports. These reports help you monitor store performance, analyze sales trends, and make informed business decisions.
Through the Reports module, you can:
-
View daily, weekly, or monthly sales summaries.
-
Track inventory movement and stock valuation.
-
Analyze product performance by category, location, or date.
-
Export reports in various formats for accounting or recordkeeping.
Tip: Regularly reviewing reports helps you identify best-selling products, monitor low stock, and evaluate staff or location performance. This data-driven insight supports better inventory control and profitability planning.
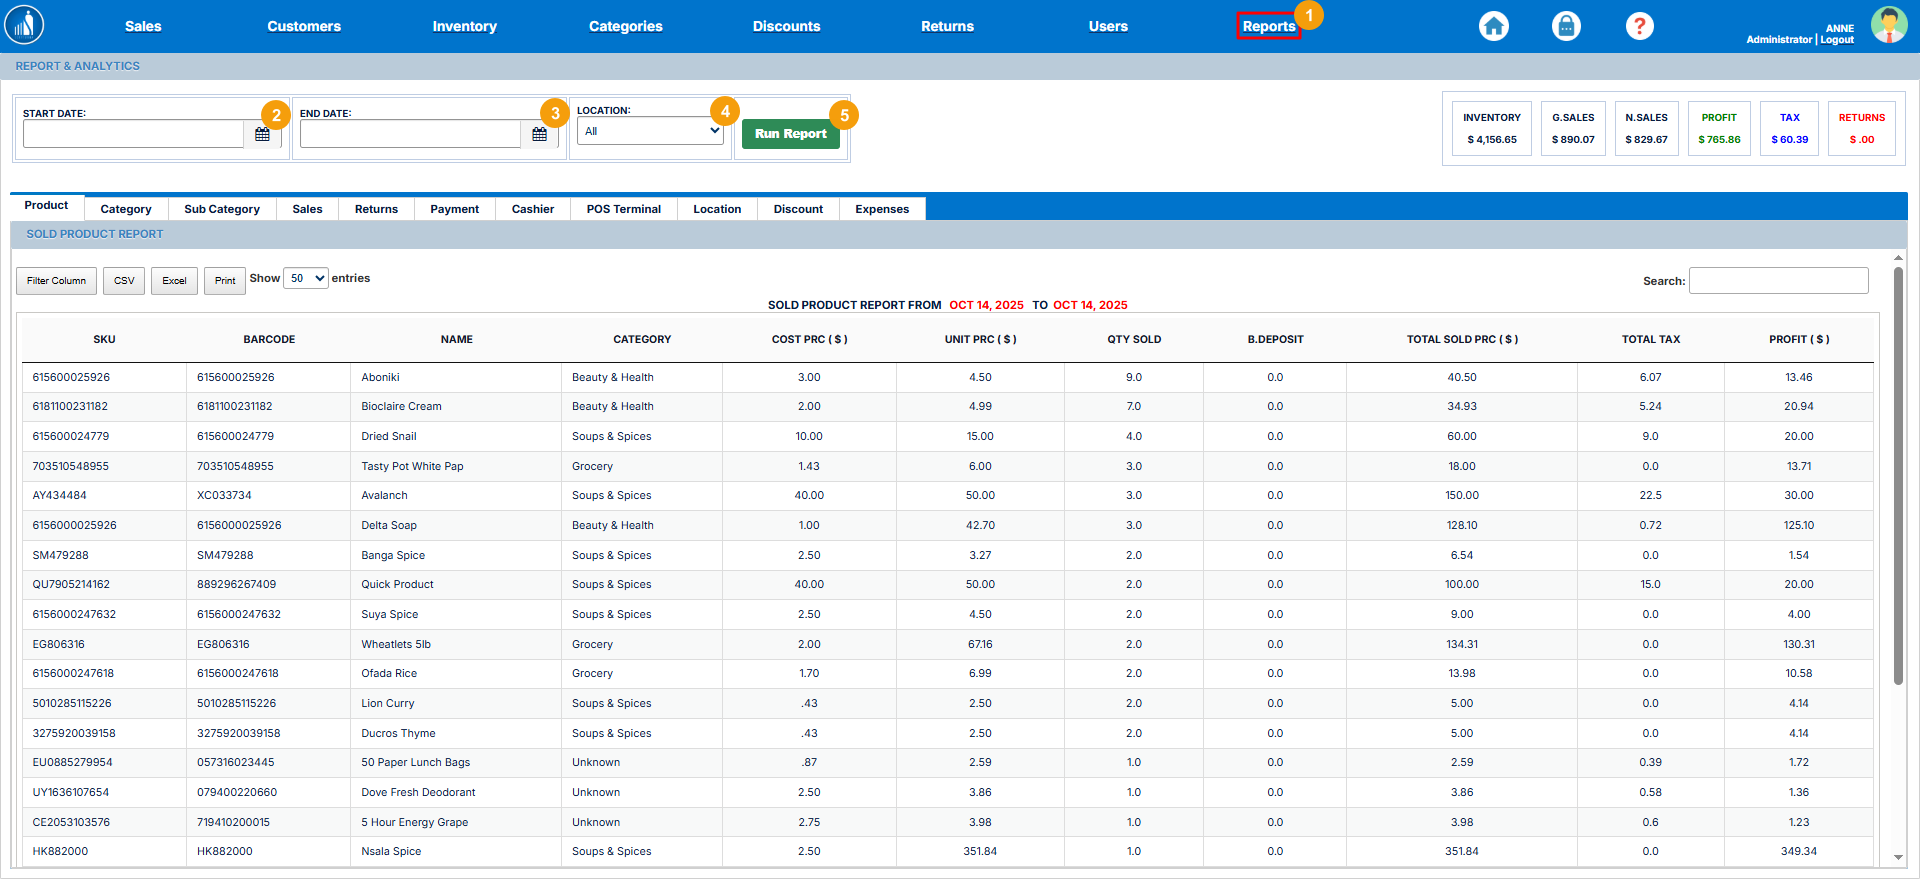
How to Generate a Report
The Reports tab allows you to viewgenerate thedetailed salesinsights on sales, inventory, and inventorybusiness reports.
How to Generatewithin a Report?
specific time period. You can customize your report by selecting dates and store locations.
1.To generate a report:
-
Go to the Reports tab.
-
2. -
3. -
4.SelectChoose alocation.Location (if you manage multiple stores). -
5.
Note: The system automatically generates various reports for the selected period. You can switch between tabs within the Reports section to view different report types such as sales, inventory, and performance summaries.
Tip: Use date filters to compare performance across different periods — for example, month-over-month or year-over-year — to identify trends and improve sales strategies.
The
automatically generates the different reports for the selected period, which you can view by switching the tabs.
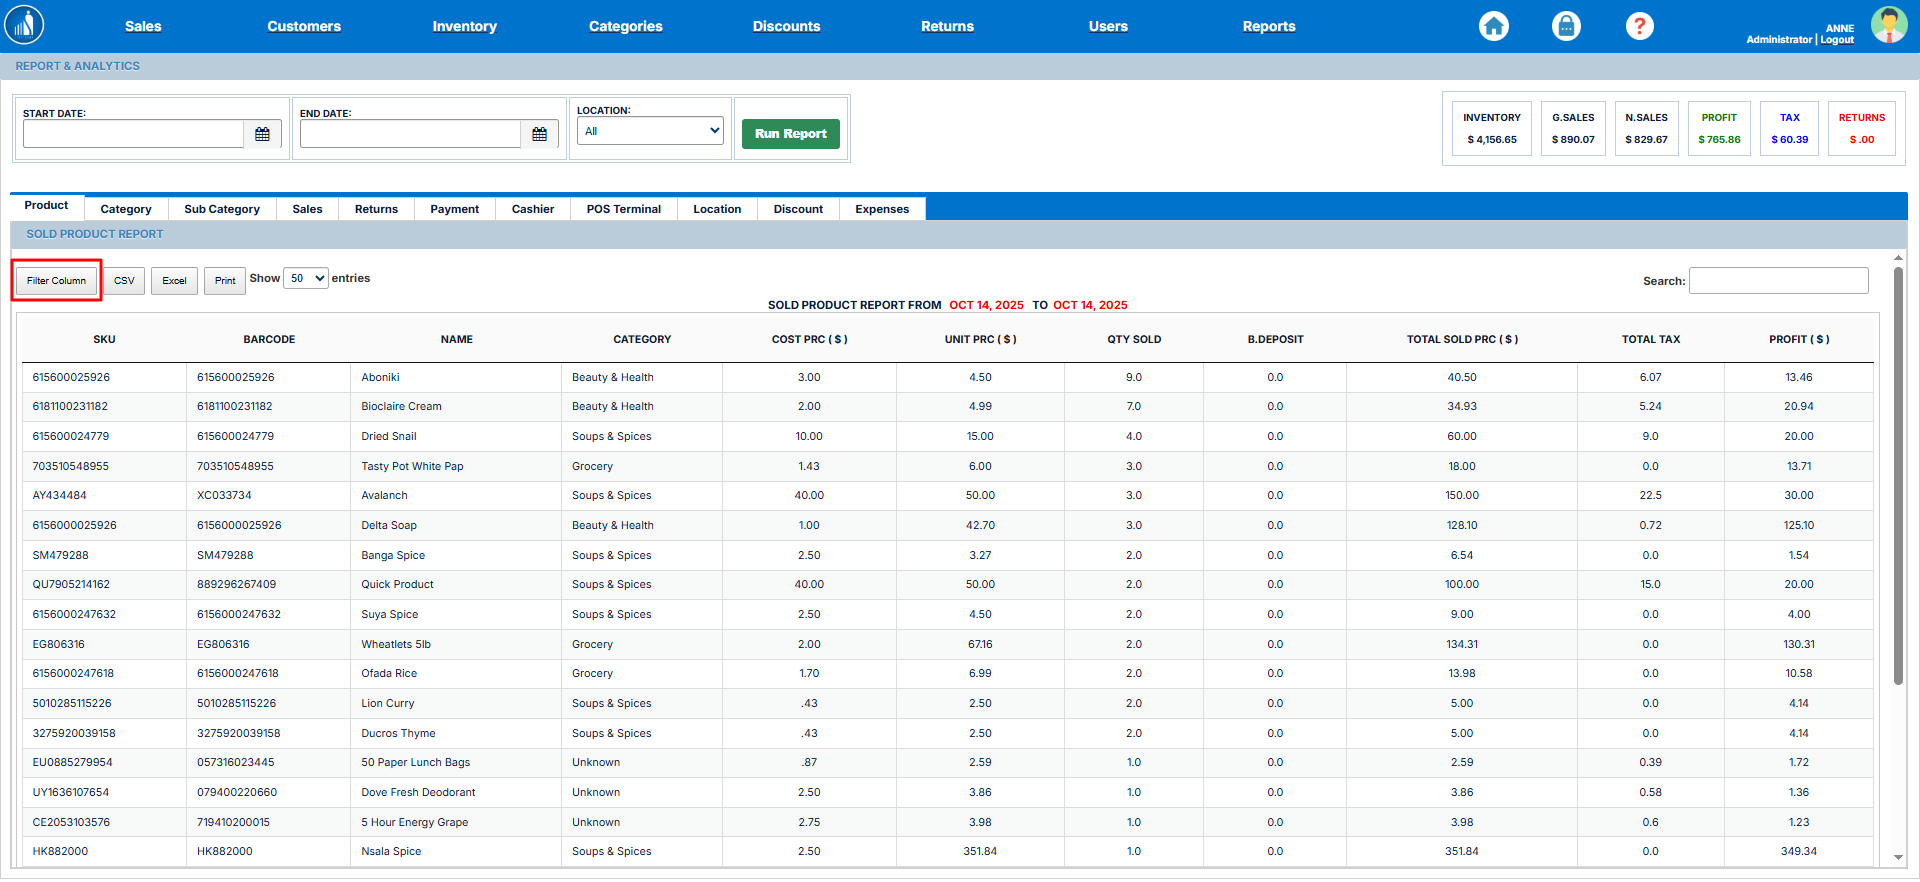
How to Filter Reports?
Reports
OnceAfter generating a report, Scantranx allows you to filter the displayed data to focus on the most relevant information. This helps you analyze specific metrics without being overwhelmed by unnecessary details.
To filter a report:
-
Generate a report
hasusingbeenthegenerated,stepsyououtlinedcaninfiltertheitpreviousbysection.clicking -
Click on the Filter Column
buttonbutton.and -
Select or deselect the desired
columns.columns to show or hide specific data points.
Note: Filtering does not delete any data — it simply customizes the report view for easier analysis.
Tip: Use filters to focus on key metrics like product performance, sales by employee, or inventory value. Customizing your view helps you make faster, data-driven decisions.
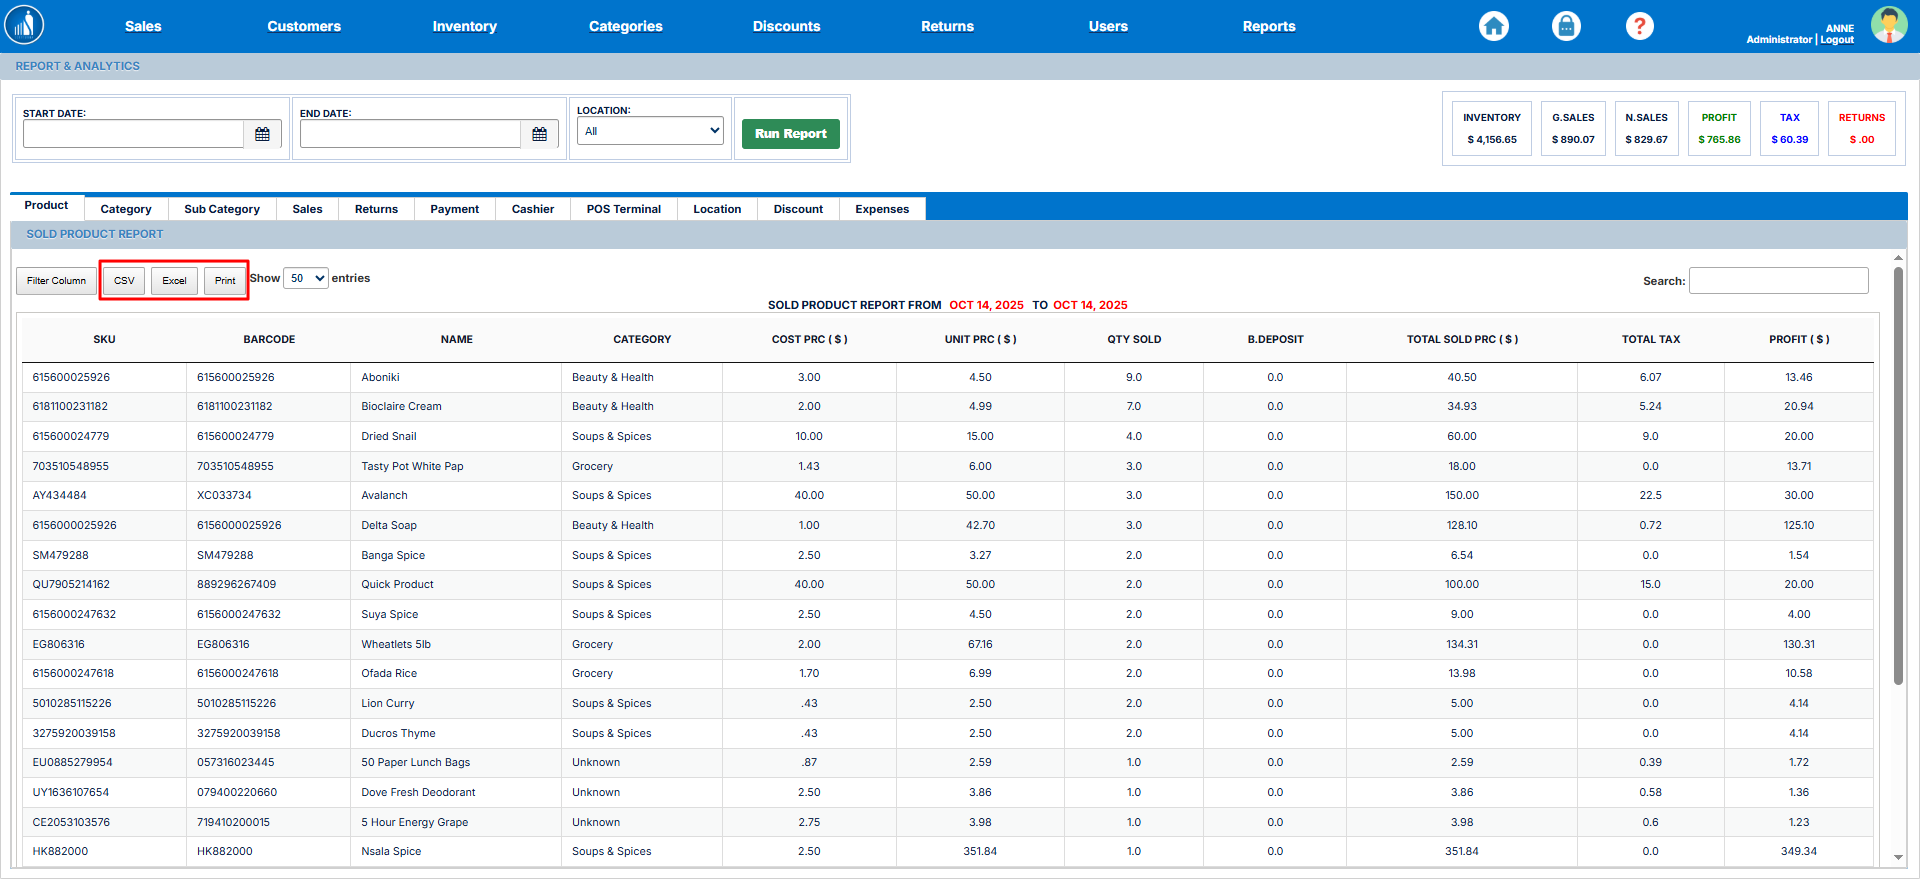
How to Export a Report?
Report
Scantranx allows you to export reports in multiple formats for recordkeeping, sharing, or further analysis. You can download reports as CSV, Excel, or PDF files — or print them directly from the system.
To export a report:
-
Generate the desired report
tofrom theCSV, Excel, or PDF/PrintReportsbytab.clicking -
Click on the corresponding
button.export button — CSV, Excel, or PDF/Print. -
The report will be downloaded or opened in your selected format.
Tip: Export reports regularly for accounting, management review, or backup purposes. Excel and CSV formats are ideal for further data analysis, while PDF is best for printing and official reporting.
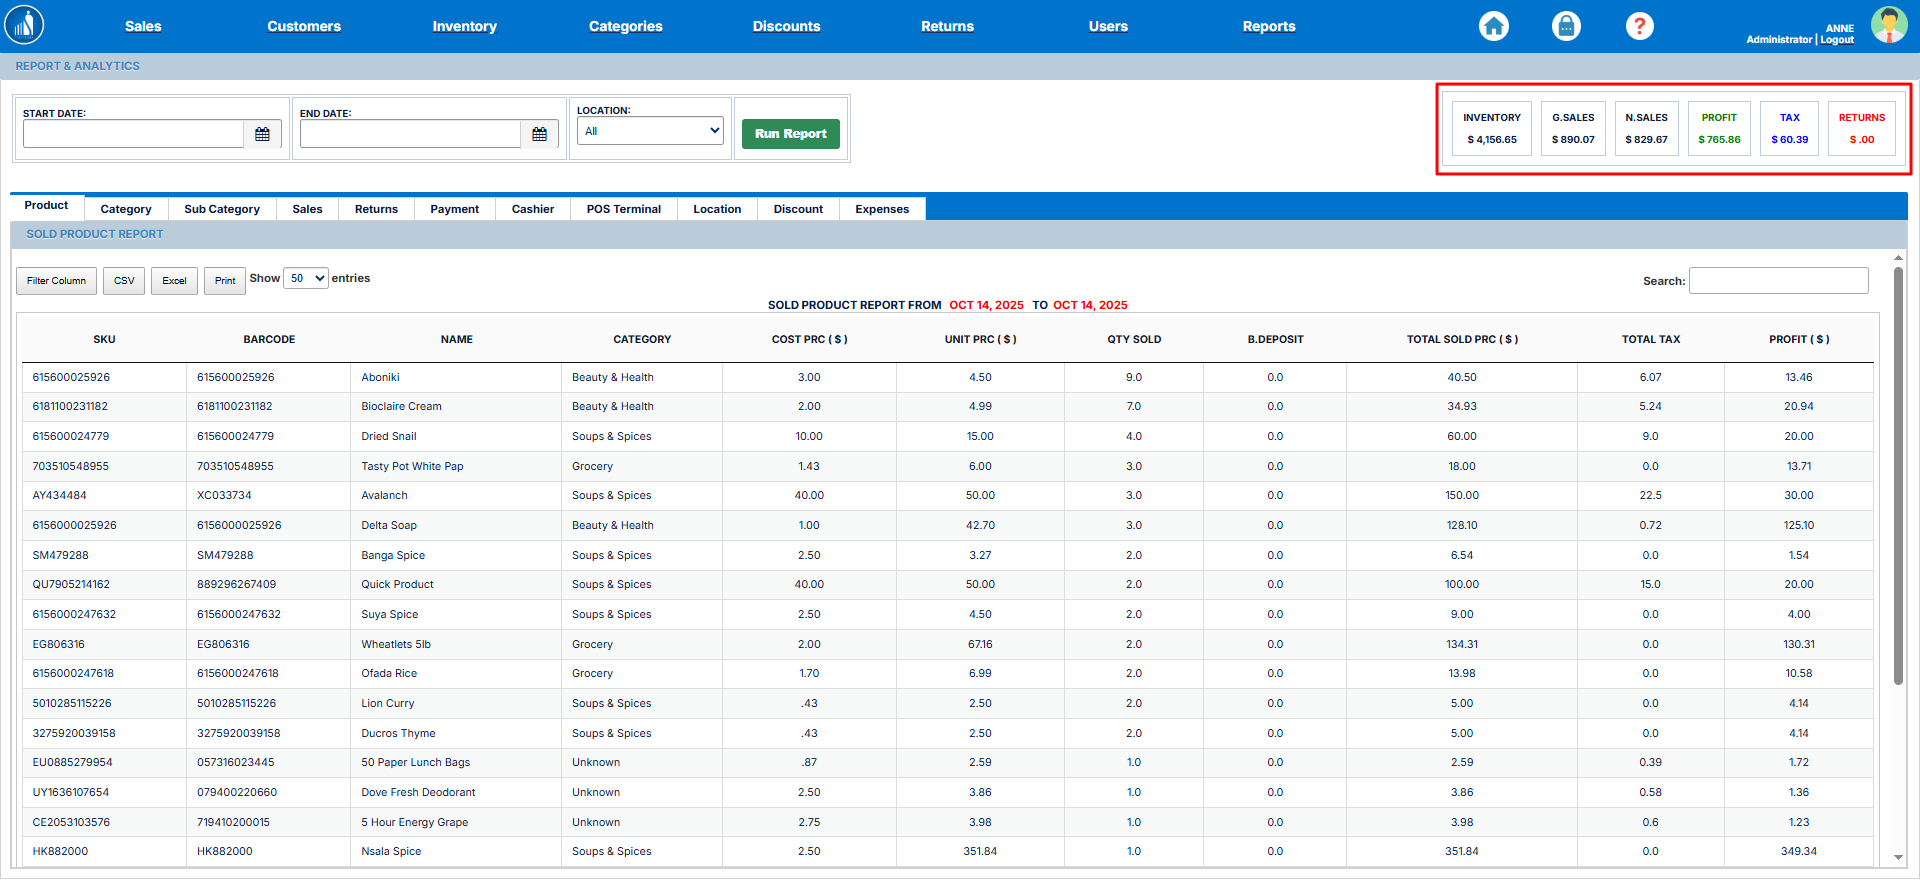
Summary Report
OnThe Summary Report provides a quick snapshot of your business performance, displaying key financial and inventory metrics in one place. It appears on the top-right side of the screen under the Reports tab,tab youand canupdates seeautomatically based on the summarizedselected reportreporting for inventory, sales, net sales, profits, tax, and returns.period.
ItThe includes:summary includes the following details:
-
Inventory:
Shows the worth ofDisplays the total value oftheallinventory.inventory currently in stock. -
Gross Sales:
TotalShows the total sales within the selectedperiodperiod, includingthe tax.tax. -
Net Sales:
TotalIndicates total sales within the selectedperiodperiod, excludingthe tax.tax. -
Profit:
TheRepresents the total profitmadeearnedthrough thefrom saleswithinduring the selected period. -
Tax:
TotalDisplays the total amount of tax collectedthroughfrom sales. -
Returns:
TotalShowssalesthe total value of products returned within the selected period.
Tip: The summary report gives you an at-a-glance overview of your store’s performance. Review it regularly to monitor profitability, tax collection, and stock value without running detailed reports.