Dashboard Overview
When youAfter successfully loglogging in to your account,in, you will landbe ondirected to the Dashboard., Beforewhich movingserves forward with other features, let’s exploreas the dashboardcontrol center for your store’s daily operations. It provides a bit:quick overview of sales performance, inventory levels, and key business metrics — all in one place.

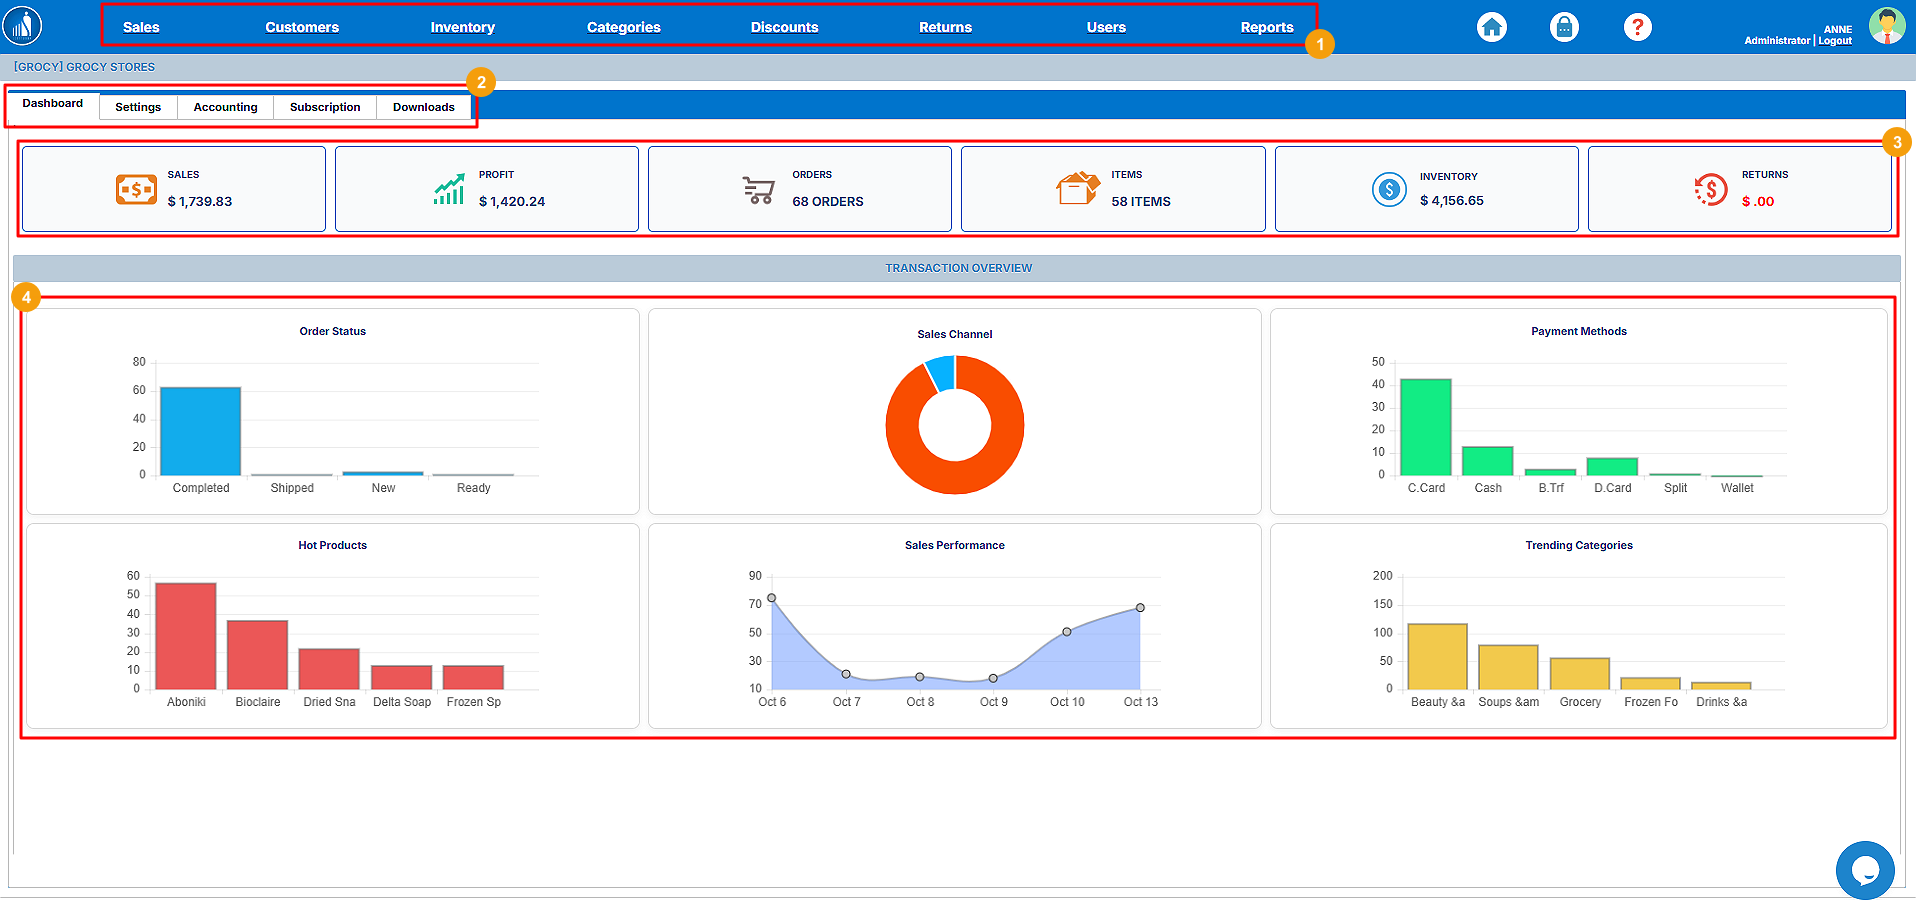
1. Navigation Bar:Bar
Located at the top of the screen.page, the Navigation Bar provides access to the main modules of the Scantranx system:
-
oYouPerformcanandperformreview allthesalessales-related tasks under this tab.transactions. -
oThis tab provides you with the tools to manage customers.oInventory:yourcustomerinventoryprofiles andproductsloyaltyhere.details. -
oCategories:Inventory: Add and manageproductproducts,categories.stock levels, and transfers. -
oDiscounts:Categories:OfferOrganizediscountsandtoclassify yourcustomers.products.o -
oUsers:Discounts: Create andeditmanagenewcustomer discounts andexisting users.coupons. -
oReturns: Handle product returns and refunds. -
Users: Manage staff accounts and permissions.
-
Reports:
Generate,Generateviewdetailedandbusinessexport differentperformance reports.
Sub-Navigation Tabs
We will explore each tab in more detail later inBelow the guide.main bar, you’ll find quick-access tabs for specific system sections:
-
-2.DashboardSub-Navigation:–This is another navigation bar that allowsReturns you toaccess different features intheprogram,overview screen. -
Settings – Configure business profile, payment options, and preferences.
-
Accounting – Set up your accounting platforms such as
Dashboard,QuickBooksSettings,orAccounting, etc.Xero. -
3. Cards:SubscriptionShow– View or update your Scantranx plan details. -
Downloads – Access system resources or reports available for download.
Summary Cards
At the stats in numbers.
4. Transaction Overview: Graphical representationtop of the sales,dashboard are Summary Cards displaying real-time statistics:
-
Sales: Total sales amount within the selected period.
-
Profit: Net profit generated.
-
Orders: Number of orders completed.
-
Items: Total active products in inventory.
-
Inventory Value: Current stock valuation.
-
Returns: Value of refunded or returned items.
Transaction Overview (Charts & Analytics)
The lower section presents graphical data visualizations that help track trends and transaction data.performance:
-
-
Sales Channel: Breakdown of sales by platform (e.g., in-store, online). -
Payment Methods: Distribution of sales across different payment options (Cash, Card, Wallet, etc.).
-
Hot Products: Shows your top-selling items.
-
Sales Performance: Line graph illustrating sales growth over time.
-
Trending Categories: Highlights the most popular product categories.
Tip: Use the dashboard regularly to monitor key performance indicators (KPIs) and identify trends that help you make informed business decisions.